One of the TecPlot data formats is a simple ASCI format. It is deprecated but can be opened in both TecPlot and Paraview. This data format has variations so further I will use it for atoms and velocity profiles visualizations.
In the simplest case, the file consists of header section where it is needed to specify names of columns:
1
| |
And so called “ZONE” section which consists of header and columns:
1 2 3 | |
This format can be used for the velocity and density fields visualization. To obtain this data from the simulation, you need to use fix ave/spatial:
1
| |
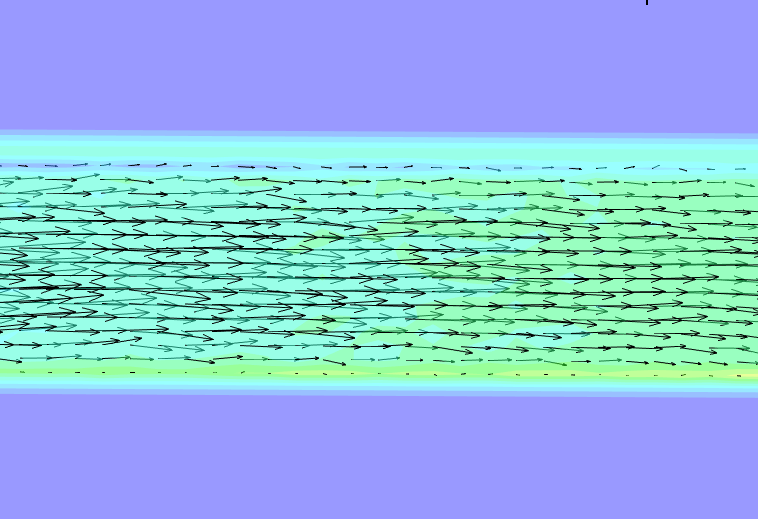
This fix writes data in lammps own data format which can not be read by tecplot by default. In order to simplify your life and avoid modifying output file by hands, I modified this fix a little bit so if the file has extension “tec”, fix writes in the tecplot data format. It is difficult to do in post processing script because tecplot requires information about bins in every direction. Replace you ave/spatial with fix_ave_spatial.h, fix_ave_spatial.cpp, build and run LAMMPS. In order to open “velprof.tec” in tecplot go File->Load DataFile -> TecPlot data loader. In the left panel choose “Contour” (pick up D column, it is density). Then on the same panel click on “Vector” and choose columns “VX”, “VY”, “VZ”. I usually use slices for visualisation, in order to have slice Click “Slices” on the left panel, then specify properties of your slices, then go Data->Extract->Current Slices… In Zone styles panel you may define which slices are visible and which ones are not. So at the end you might have picture like the following one:
In addition to that you may visualise your particles using tecplot. In order to do this, you need to use restart2data tool (lammps->tools), and then atom2plt script. The pipeline is the following:
1 2 | |
After that you will have *.plt file which can be opened in TecPlot. If you domain is periodic and you see some long dark lines, cut in tecplot your data a bit. Note, that this code works only for molecular atom style and in 3D. If you need another configuration and changed mentioned code, I would be glad if you commit in corresponding git repository or send me a patch.